David,
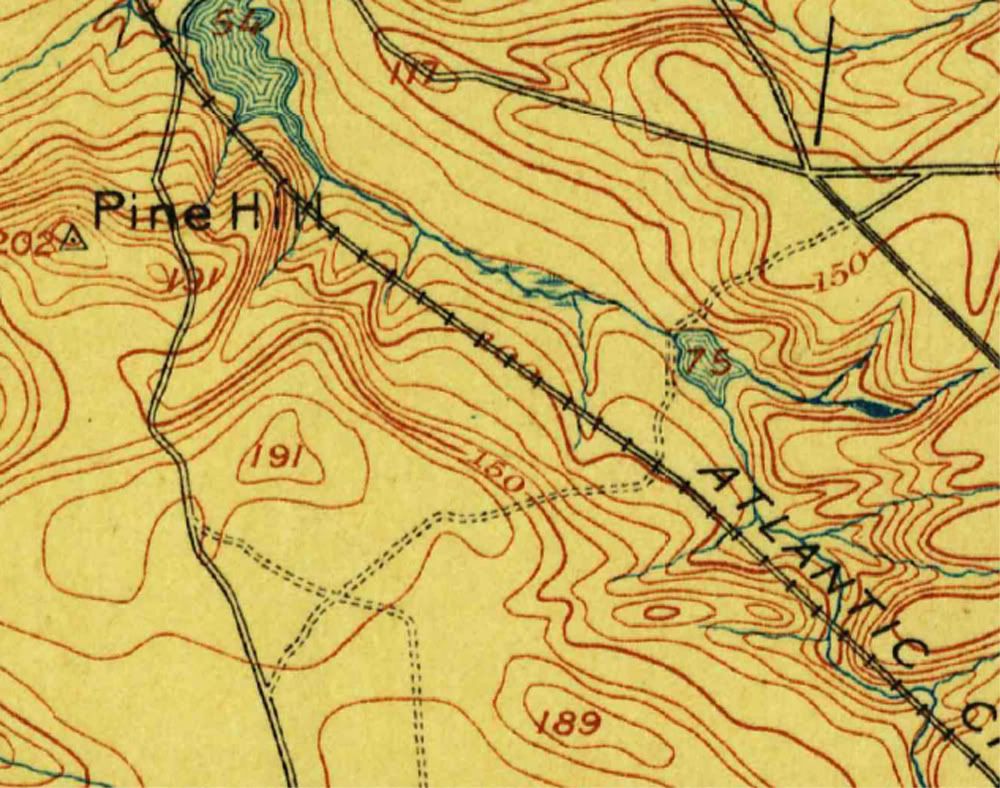
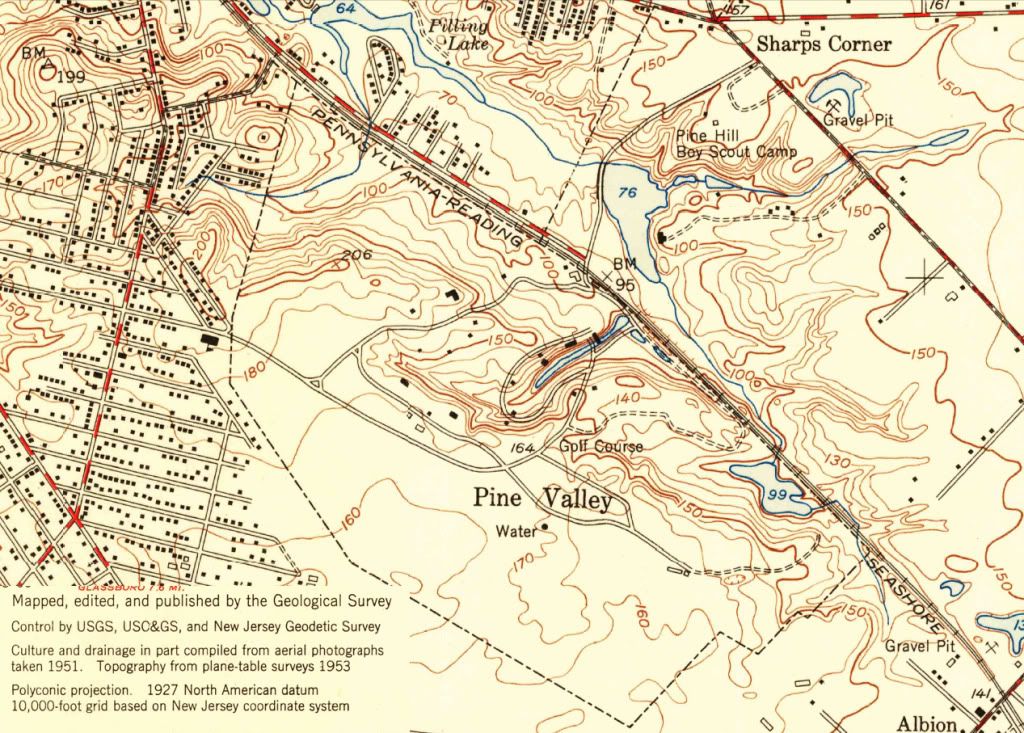
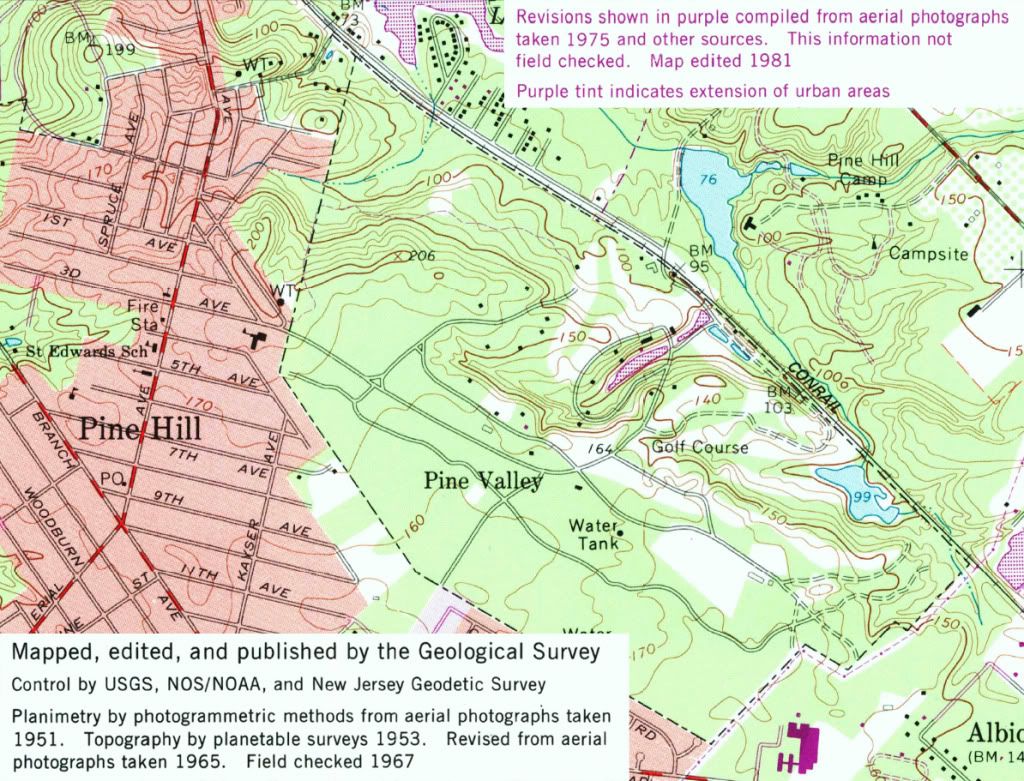
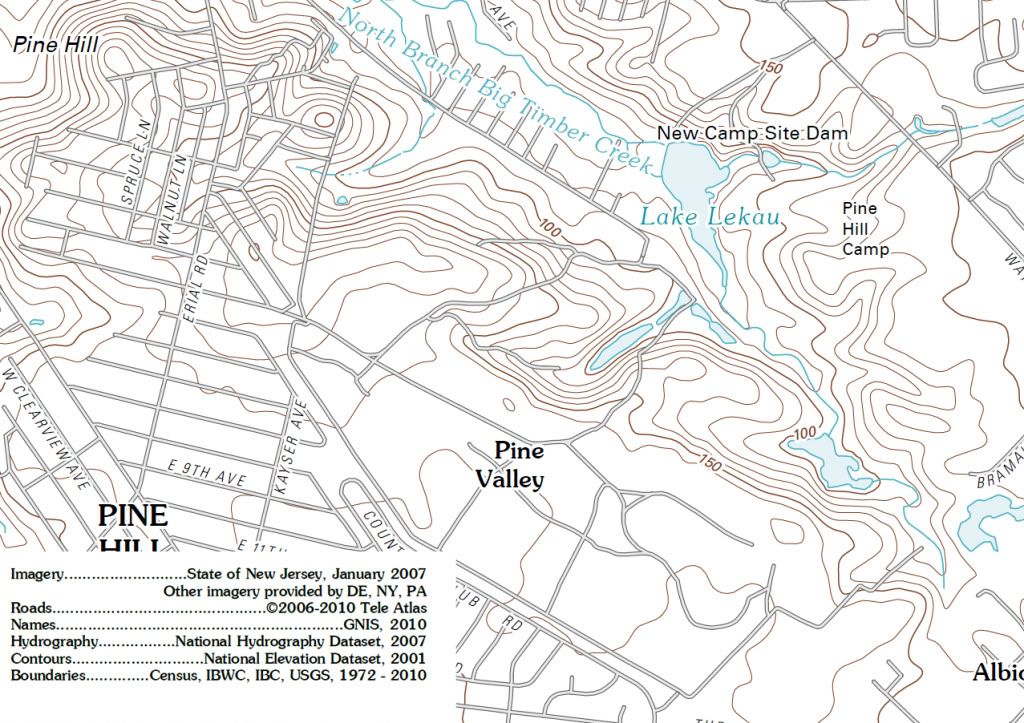
Here are 5 versions, over time, of topo maps for the Pine Valley area. Some of them indicate on the map when the survey was completed as opposed to when the map was imprinted. For instance the 1898 topo we are familiar with was based on an 1885 survey.
1898 (1885 Survey)

1942 US Army

1953 (1953 Survey)

1967 (1953 Survey amended with newer information)

2011 (2001 NED)

Apart from the differences in the contours, note that the Pine Hill Benchmark (BM) has changed from 202 to 206 to 199 to somewhere more than 190 and less than 200. I suppose that means that as technology has advanced even the BM's have changed. Also note how the 189 foot knob to the southwest of the 7th tee seems to have eroded and disappeared over time.
The latest one, based on the 2001 NED (whatever data is included in that) seems to have contours that are more smoothed out than previous versions. Perhaps they've changed their approach or algorithm for contouring in the last 30 years. It's interesting that the 170 foot nose down the 7th tee and fairway has also been smoothed out in the 2011 printing.
As best as I can find out to this point, it's not obvious that the base survey data has changed at all since 1953 in this area. The 1967 map suggests amendments based on aerial photography, but that more likely has to do with the overlay features. If you can find anything more definitive about what elevation data for this particular area is being used for any specific map or for the NED, I could be convinced otherwise.
I think the 2001 NED was not a new set of data, but rather just a repackaging of the existing data of the time into a database to support the seamless National Map.
From the USGS history:
The National Map
In 2001, the USGS released its vision for the topographic map of the 21st Century, The National Map, a seamless, continuously maintained, nationally consistent set of base geographic data; developed and maintained through partnerships; a national foundation for science, land and resource management, recreation, policy making, and homeland security; available over the Internet; and the source for revised topographic maps. The National Map, a collaborative effort to improve and deliver topographic information for the nation, consists of eight data layers: transportation, hydrography, boundaries, structures, geographic names, land cover, elevation, and orthographic images. The goal of The National Map is to become the nationís source for trusted, nationally consistent, integrated, and current topographic information available online for a broad range of uses. The seamless databases constructed in the 1990s and early 2000s became the base data for The National Map, with additional data from federal, state, local, and tribal sources being added.
The NED
In the 1990s, the USGS moved from quadrangle areas, usually constructed from 7.5-minute, 15-minute, 30-minute or 1-degree areas, to seamless nationwide layer-based datasets. The first of these completed was the National Elevation Dataset (NED), a multi-resolution seamless, nationwide mosaic of elevations created from existing USGS databases of 7.5-minute tiles with 30 m horizontal spacing, 7-meter root mean square error (RMSE), 1-degree tiles with 3-arc-second horizontal spacing, and a vertical RMSE of 30-meter. The USGS has continued to improve the NED with elevations on a 10-meter horizontal spacing that is now available for the conterminous 48 states, and most recently with lidar data generating elevations on a 3-meter horizontal spacing.
The continuous improvement to the 10 meter horizontal spacing I think has led to the 1/3 arc second database, and the LIDAR data for the 3 meter horizontal spacing has led to the 1/9 arc second database. The metadata for the 1/3 data I downloaded is not specific about the source of the data. I don't know of another way to figure it out. The 1/9 data must be within the last 5 years or so, and almost certainly wasn't in the 2001 NED used to create that 2011 topo above.
The RMSE's above don't give much confidence in the accuracy of the elevation data.
For further elaboration on the vertical accuracy of the NED, you could look at the following site if you haven't already.
http://ned.usgs.gov/downloads/documents/NED_Accuracy.pdfA couple of snippets:
The accuracy of the National Elevation Dataset (NED) varies spatially because of the
variable quality of the source digital elevation models (DEMs). As such, the NED
inherits the accuracy of the source DEMs. Some accuracy statistics are available in the
header records of the USGS DEM source files, and this information is captured in the
spatially referenced metadata. Many times, this accuracy information has limited
usefulness because it is a relative measure of how well the DEM fits the source material
from which it was generated. In an effort to provide more information to users on the
vertical accuracy of the NED, the data set has been tested by comparing it with an
independent reference source of very high accuracy.
Absolute Vertical Accuracy
To complete the accuracy assessment, the NED value at each of the NGS control point
locations was derived through bilinear interpolation, and error statistics were calculated
(Table 1). The overall absolute vertical accuracy expressed as the root mean square error
(RMSE) is 2.44 meters. Table 1 also contains the accuracy expressed in terms of the
National Map Accuracy Standards (NMAS), which use a 90 percent confidence interval,
and in terms of the National Standard for Spatial Data Accuracy (NSSDA), which uses a
95 percent confidence interval. The methods described in Maune et al. (2001) were used
to convert the measured vertical RMSE to equivalent NMAS and NSSDA expressions.
The paper doesn't fill me with absolute confidence about the absolute elevations that you want to use as absolutely "right". But, that's just me.
I still think after all this that the contouring in the 1913 topo is better than that in any of the published USGS topo maps. Trying to establish whether the absolute elevations are "right" or "wrong" is not very useful. Trying to use the USGS topos and the 1913 top over time to determine changes in topography also appears to be a waste of time.