David,
Here's another exercise re the 1/9 arc second NED you want to use as your benchmark of the accuracy of the century old PV topo.
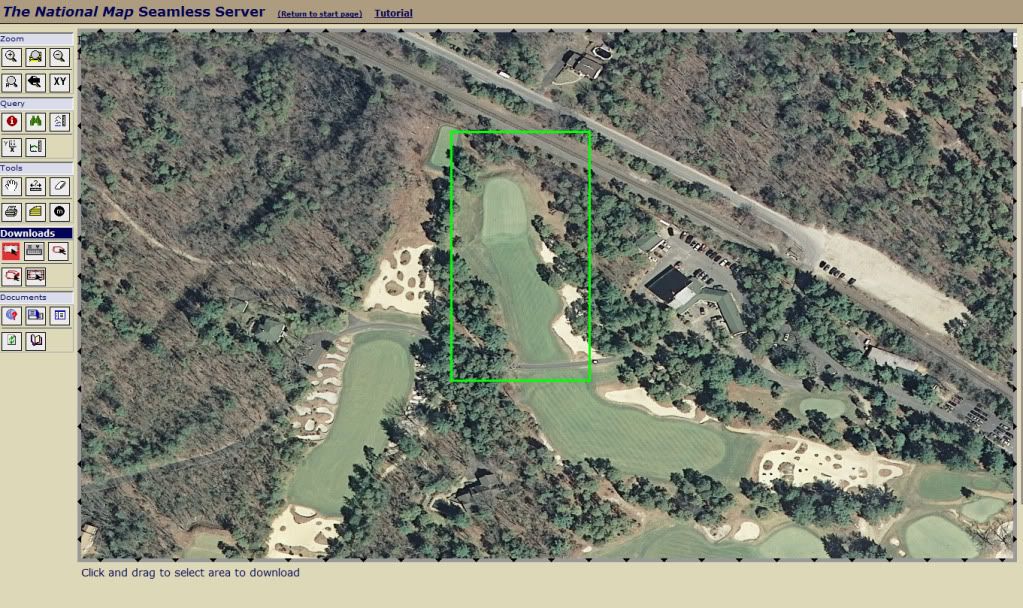
Have you tried downloading a segment of the actual data for any part of PV? I tried. One lesson learned - make sure you edit the download to select the 1/9 data. As a trial, I downloaded the data (in the green rectangle) for a part of the first fairway and green.

Of course, the downloaded file is not directly readable, but they do provide metadata for the file.
"Raster Download Information
Number of columns: 29
Number of rows: 51
Resolution in x direction: 3.08641999998043E-05 Degree
Resolution in y direction: 3.08642000000108E-05 Degree
Coordinate system ID Native: 4269
Top edge Native: 39.7930178265366 Degree
Bottom edge Native: 39.7914437523366 Degree
Left edge Native: -74.9736742404835 Degree
Right edge Native: -74.9727791786835 Degree
Coordinate system ID WGS84: 4326
Top edge WGS84: 39.7930178265366 Degree
Bottom edge WGS84: 39.7914437523366 Degree
Left edge WGS84: -74.9736742404835 Degree
Right edge WGS84: -74.9727791786835 Degree"
So, for my rectangle I've got 1479 data points with spacing of 3.0864E-05 degrees or about 11 feet. So,it seems I've got 1/9 data.
According to the USGS the 1/9 data generally has vertical accuracy of +/- 1 meter (3.3 feet).
"National Elevation Dataset (NED) 1/9 Arc Second (approx. 3m)
Resolution 1/9 arc-second (approx. 3m) Cont. U.S. - Where available (see The National Map Seamless Server for current coverage)
Projection Geographic
Horizontal Datum NAD83
Vertical Datum NAVD88
Vertical Units Meters
Vertical Accuracy Generally +/- 1 meter (Depends greatly on the contract source)"
The horizontal and vertical datums are from 1983 and 1988 respectively.
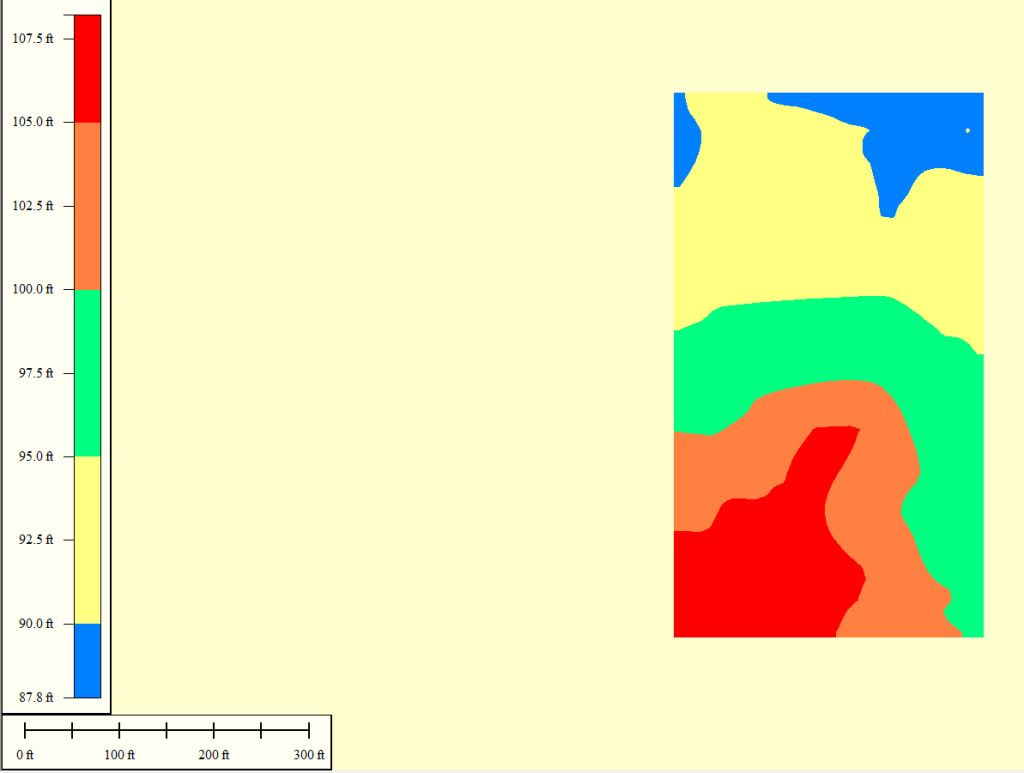
So, what to do with the data. Get a free trial copy of Global Mapper and see if I can use it to map the data and the contours. Using Global Mapper and a custom shading profile, where I made all the elevations within a 5 foot band the same color, I get the following mapping for the downloaded rectangle. The place where the color changes is, of course, the contour for that elevation.

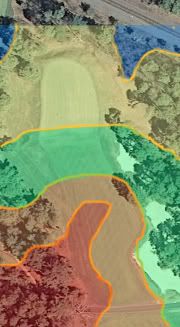
Now, overlaying that shading profile on a high resolution orthoimage of the 1st hole, I get the following map.

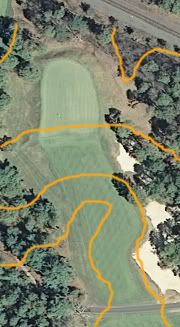
And from that I can trace the contour lines at 5 foot intervals.

Now, one of the reasons I wanted to look at this area was because there is a nice picture of the first green at PV from Ran's write-up. It was from the right side of the green and shows a sharp drop off of 6 or 8 or 10 feet (I'm sure the peanut gallery will provide precise estimates of the drop off). Ran says it extends around three sides of the green.

Now, the data seems to have enough horizontal resolution (11 feet) and vertical accuracy (+/-3.3 feet) that the fall offs around the three sides of the green should be reflected in the 1/9 NED data.
But, they are not. The data suggests the green runs away by 4 feet from front to back. It doesn't look like it in the photo.
What is going on with the data? It should have enough resolution and accuracy to show the features of the landform.
How can we trust it as an absolute benchmark to compare to the 1913 topo (forgetting for a moment that trying to validate two measurements of this sort over a century is unsound in the first place.
As to the absolute difference in elevations, we know that the benchmark elevation datum is 3 feet different in the two time periods. We know that the 1/9 NED data has a +/-3.3 foot margin of error. And, now, there is doubt in my mind that the data you purport to be precisely accurate can't discern elevation changes of 6 or 8 or 10 feet. How can we place faith in your assertion that the 1913 foot topo is "off" or "wrong" based on your sample of half a dozen points that may not even be in exactly the same place?