EDIT - HELP - THE DAMN TABLE AND GRAPH BELOW ARE TOO SMALL TO READ. ANY SUGGESTIONS WITH PHOTOBUCKET? THEY ARE EXCEL CHARTS.
END OF EDIT, MY APOLOGIES FOR THE SMALL TABLE/CHART
Matt
great to hear you had a good day - your efforts to get there deserved it.
This thread has encouraged me to develop an analysis I have thought about before but hadn't done before. It uses the data from the Ocean course players (90 rounds) and compares the average score of each hole, the standard deviation on each hole (measuring the spread of scores) and presenting the outcome graphically.
The graph has the holes in length order, par 3's first and par 5's last (I saw this on Mike Nuzzo's work, and more recently on Stanley Thompson's via Geo Thomas's book Golf Architecture in America). The hole numbers are on the x-axis, the yardage of the hole on the left hand axis and the average score on the right axis. The average score is shown as a colored square, the lower value of the blue line for a hole is average less one standard deviation, the upper value is average plus one standard deviation.
I have chosen this to try to statistically show which holes provide the greatest variety of outcomes (I think TEPaul has a name for this, but I can't remember it). So, the standard deviation statistic can distinguish between two holes which average say a par of 4 over 90 rounds - one hole has 80 pars, 5 birdies and 5 bogies whilst the other hole has 20 birdies, 51 pars 18 bogies and a double bogey. Both may average 4 but the level of interest and opportunity to test skills is quite different.
I have updated the data from the Pacific Coast Amateur by adding the std deviations in the following table. The chart in yardage order follows.
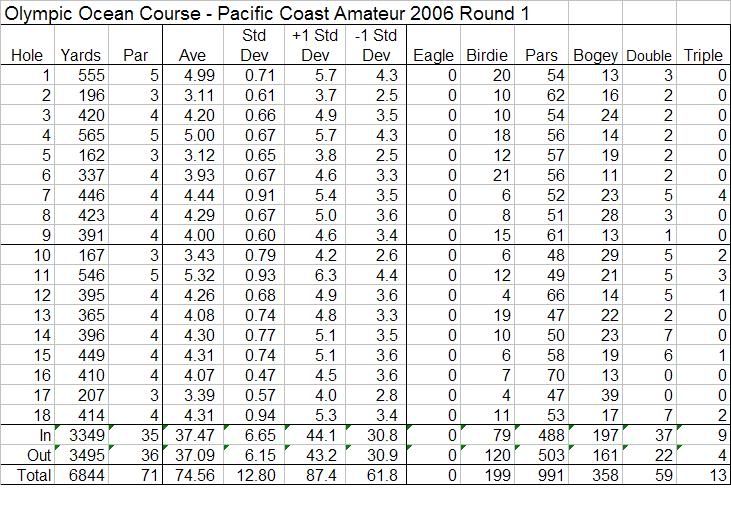
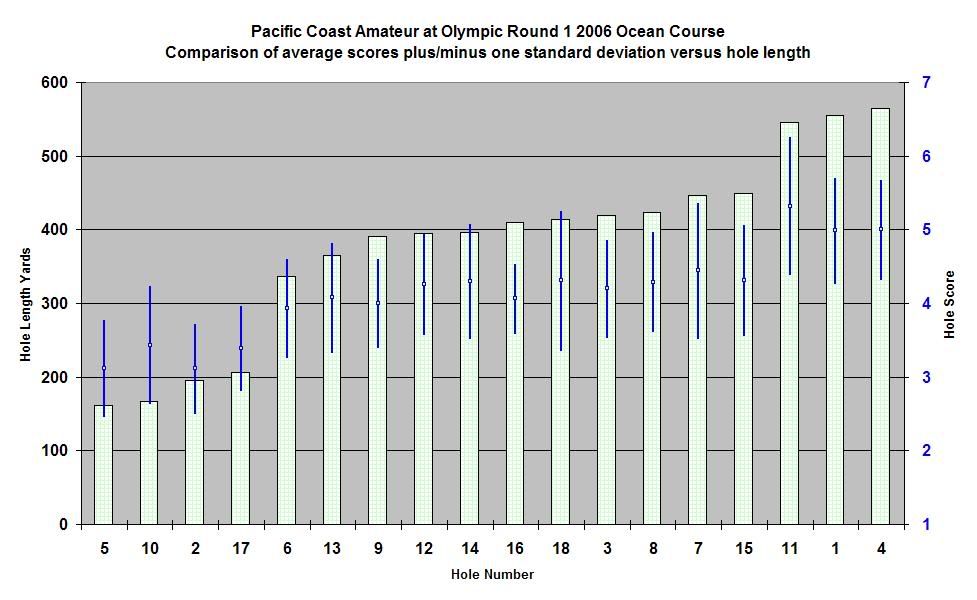
For an initial analysis, consider the 4 par 3's. Look at the average scores, and the spread of scoring. The two shorter par 3's have played more difficult and with a wider spread. I haven't seen the holes, but I expect the shot required on these holes is more exacting but one which can obtain a birdie reward if well executed.
Then consider the 3 par 5's. The 11th is slighly shorter but plays on average more difficult than the others, with a massive scoring spread. There must be a variety of hazards that come into play on this hole.
Also consider the 16th hole. Very little scoring spread on this hole - it has the highest frequency of par scores across the days play. The 17th hole also has a small scoring range (std deviation). However, the 18th hole has the widest spread (std deviation) of all holes.
You may have some other comments on the charts. Has this analysis been done before? Is it worthwhile? Perhaps it implies a method for determining a matchplay stroke index (greatest variation is hole number 1) if a reasonable sample is used. Perhaps the analysis can be used to help determine and test some alternative course set-up issues. Perhaps its just rubbish or has already been done before.
I might add the Lake course results to the thread later on the weekend. I would also be interested to look at say the 4 days of the Master's as 4 separate analyses (if I can find the data), to see how much hole location/setup/conditions will effect the std deviation. I'd also be interested to see how the std deviations fall out on the back nine. It is the most exciting TV golf, I wonder what the stats say.
James B